Every project / Techy
📊 Sorting Visualizer
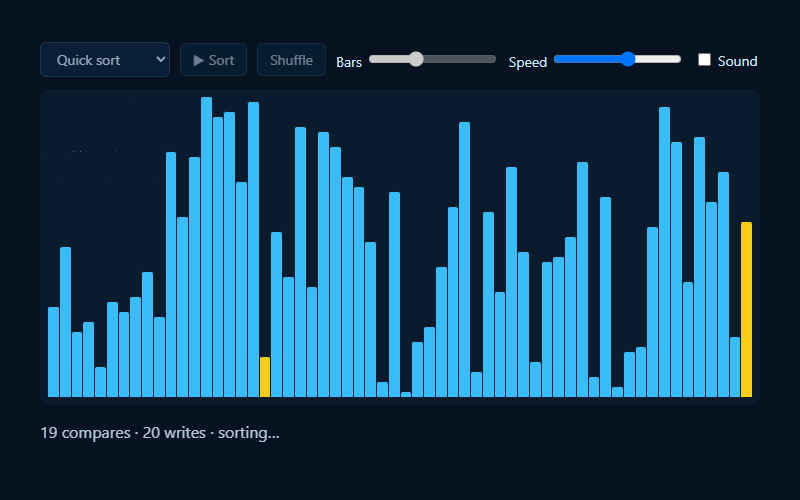
Watch bubble, insertion, selection, merge and quick sort race. Count every compare and swap.
- Language
- HTML, CSS & JavaScript
- Level
- Intermediate
- Category
- Techy
What you'll learn
- Sorting algorithms
- Generator functions (yield)
- Big-O in practice
- Recursion
- Animating data
How it works
- Every algorithm is a generator (function*) that yields each compare and each write.
- The visualizer pulls out one step at a time and colors the bars involved.
- Counting the steps shows the difference. Bubble sort takes roughly n² steps, while merge and quick sort take roughly n log n.
- The speed slider sets how long to wait between steps, or how many steps to do per frame at top speed.
Files
| File | Lines | |
|---|---|---|
index.html | 31 | the page: what shows up |
algorithms.js | 98 | Each sort is a generator (function*). Every `yield` pauses the sort and tells the |
style.css | 73 | how it looks |
visualizer.js | 107 | what it does |
Challenges
Each one is a bit harder than the last. Teachers: these make good assignment instructions.
- Sort 100 bars with bubble sort, then with quick sort. How many compares does each take?
- Add a button that starts with bars already sorted backwards (the worst case for some sorts).
- Color the bars by height, like a rainbow.
- Add another algorithm: shell sort or heap sort.
- Run two algorithms side by side on the same bars and see which finishes first.